How Customer Reviews Help Build Better Product Infographics
Learn why analyzing both your own customer reviews and competitor reviews can improve your product infographics, highlight what buyers truly care about, and increase conversions on marketplaces.
Jun 16, 2026
How Customer Reviews Help Create Better Product Infographics
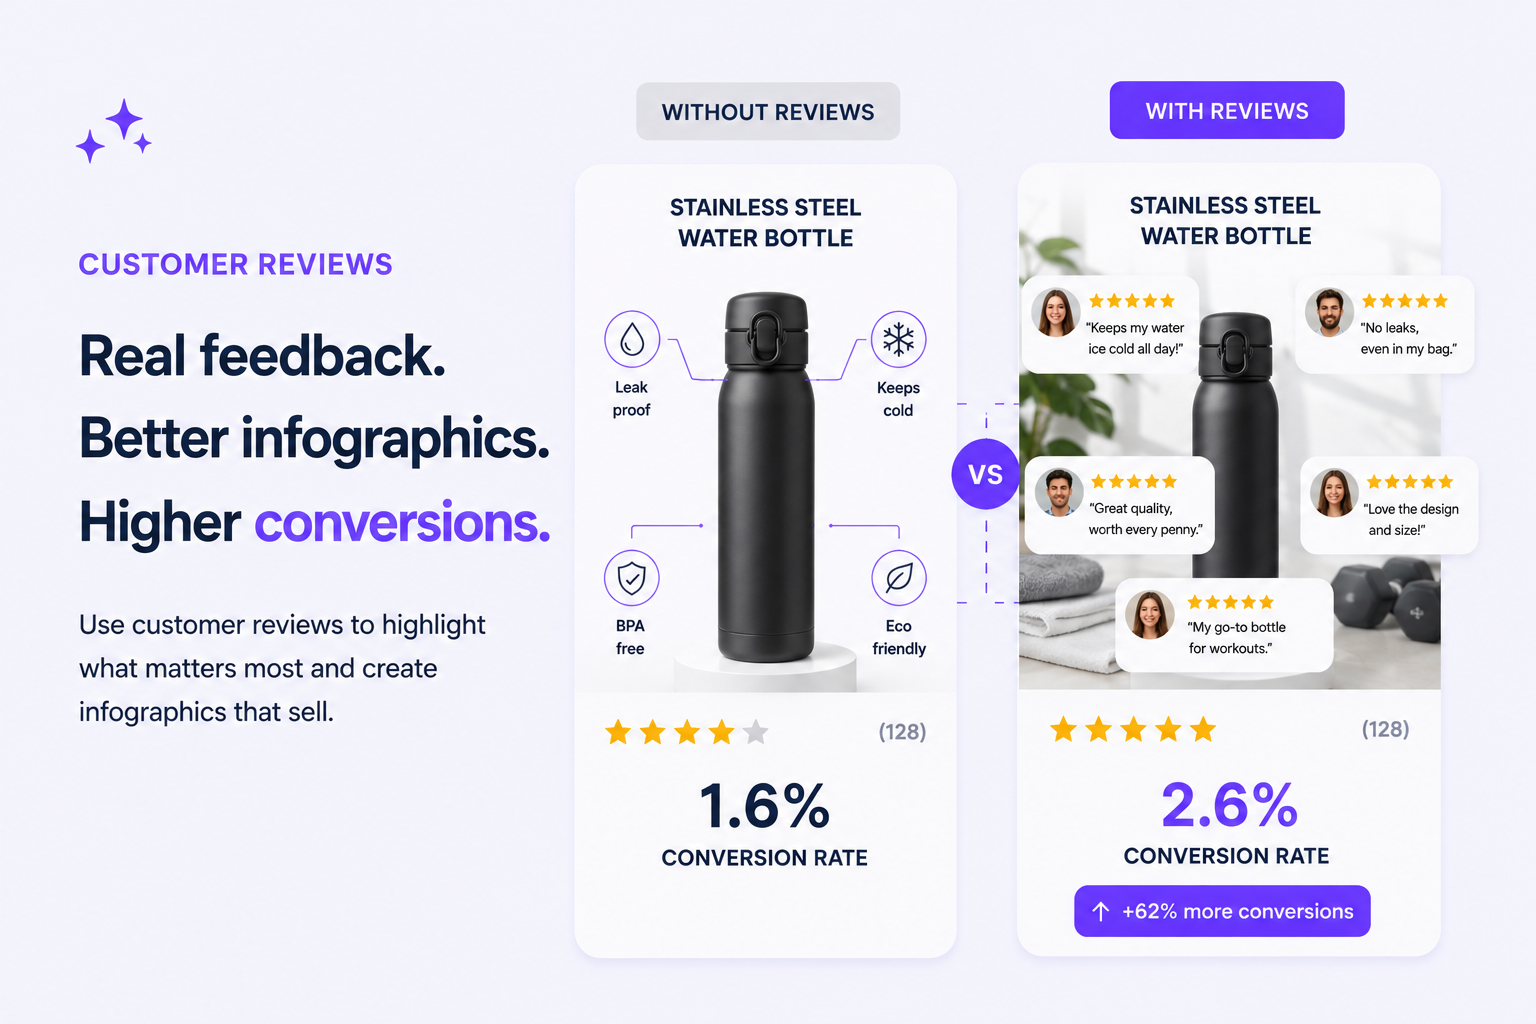
Most sellers create product infographics based on what they think matters.
The strongest sellers build infographics based on what customers actually say.
This difference directly affects conversions.
Customer reviews are one of the most underused sources of product optimization. They reveal what buyers love, what frustrates them, and what influences purchase decisions.
If you use this information correctly, your product images become much more persuasive.
Your Reviews Show What Customers Value Most
Your own reviews are direct feedback from real buyers.
They often reveal:
- Which features people mention most often
- What benefits matter most in daily use
- What problems your product solves
- Which objections disappear after purchase
For example:
A water bottle seller may think “stainless steel” is the main selling point.
But reviews may repeatedly mention:
- Keeps water cold for 12 hours
- Doesn’t leak in a bag
- Easy to clean
- Perfect size for gym
These are stronger infographic points because they are customer-proven.
Not assumption-based.
Competitor Reviews Reveal Market Gaps
Your competitors’ reviews are equally valuable.
This is where you find:
- Common complaints
- Missing features
- Weak positioning
- Repeated unmet expectations
For example:
If competitor reviews constantly say:
"Too small"
"Leaks after a month"
"Not warm enough"
you can turn this into your infographic advantages:
- Leak-proof design
- Larger capacity
- Extended heat retention
This allows you to position your product directly against market weaknesses.
Reviews Help Prioritize the Right Information
Most product cards fail because they overload buyers with random specs.
Reviews help you prioritize.
Instead of showing:
- Material
- Weight
- Size
- Manufacturing details
You can focus on:
- Comfort
- Durability
- Ease of use
- Real-life performance
This aligns visuals with buyer intent.
And relevance increases conversion.
Review-Based Optimization Improves Conversion
According to Spiegel Research Center:
- Products with reviews can improve conversion rates by 270% compared to products without reviews
- Shoppers spend significantly more time analyzing review-backed information
- Listings with review-driven messaging tend to reduce purchase anxiety
Baymard Institute also found that 95% of users rely on reviews during the buying decision process.
This means the language inside reviews often mirrors the language buyers use in their own heads.
Using it in infographics creates stronger resonance.
How to Use Reviews for Better Infographics
A simple process:
1. Analyze your top 50–100 reviews
Look for repeated phrases and benefits.
2. Analyze competitor reviews
Focus especially on 3-star and 4-star reviews — they usually contain the most useful details.
3. Group insights into categories:
- Benefits
- Pain points
- Objections
- Unexpected use cases
4. Turn them into visual blocks
Use short, specific, benefit-driven callouts.
Example:
Instead of:
Soft fabric
Use:
Doesn’t irritate skin after 8+ hours of wear
Much stronger.
AI Makes This Process Faster
AI can now process hundreds of reviews and extract:
- Most common benefits
- Most frequent complaints
- Emotional triggers
- High-conversion selling points
This makes infographic creation faster and more data-driven.
Instead of guessing, you build visuals based on customer psychology.
Final Thoughts
Your best marketing copy is often already written.
By your customers.
And by your competitors’ customers.
The more closely your infographic reflects real buyer priorities, the more effective it becomes.
Better insights → better visuals → higher conversions.
Ready to create your own product images?
Upload a product photo and generate marketplace-ready AI images with Sellixy in minutes.